Infographic animation production

A figure that stands still doesn't need to move. A figure that changes does.

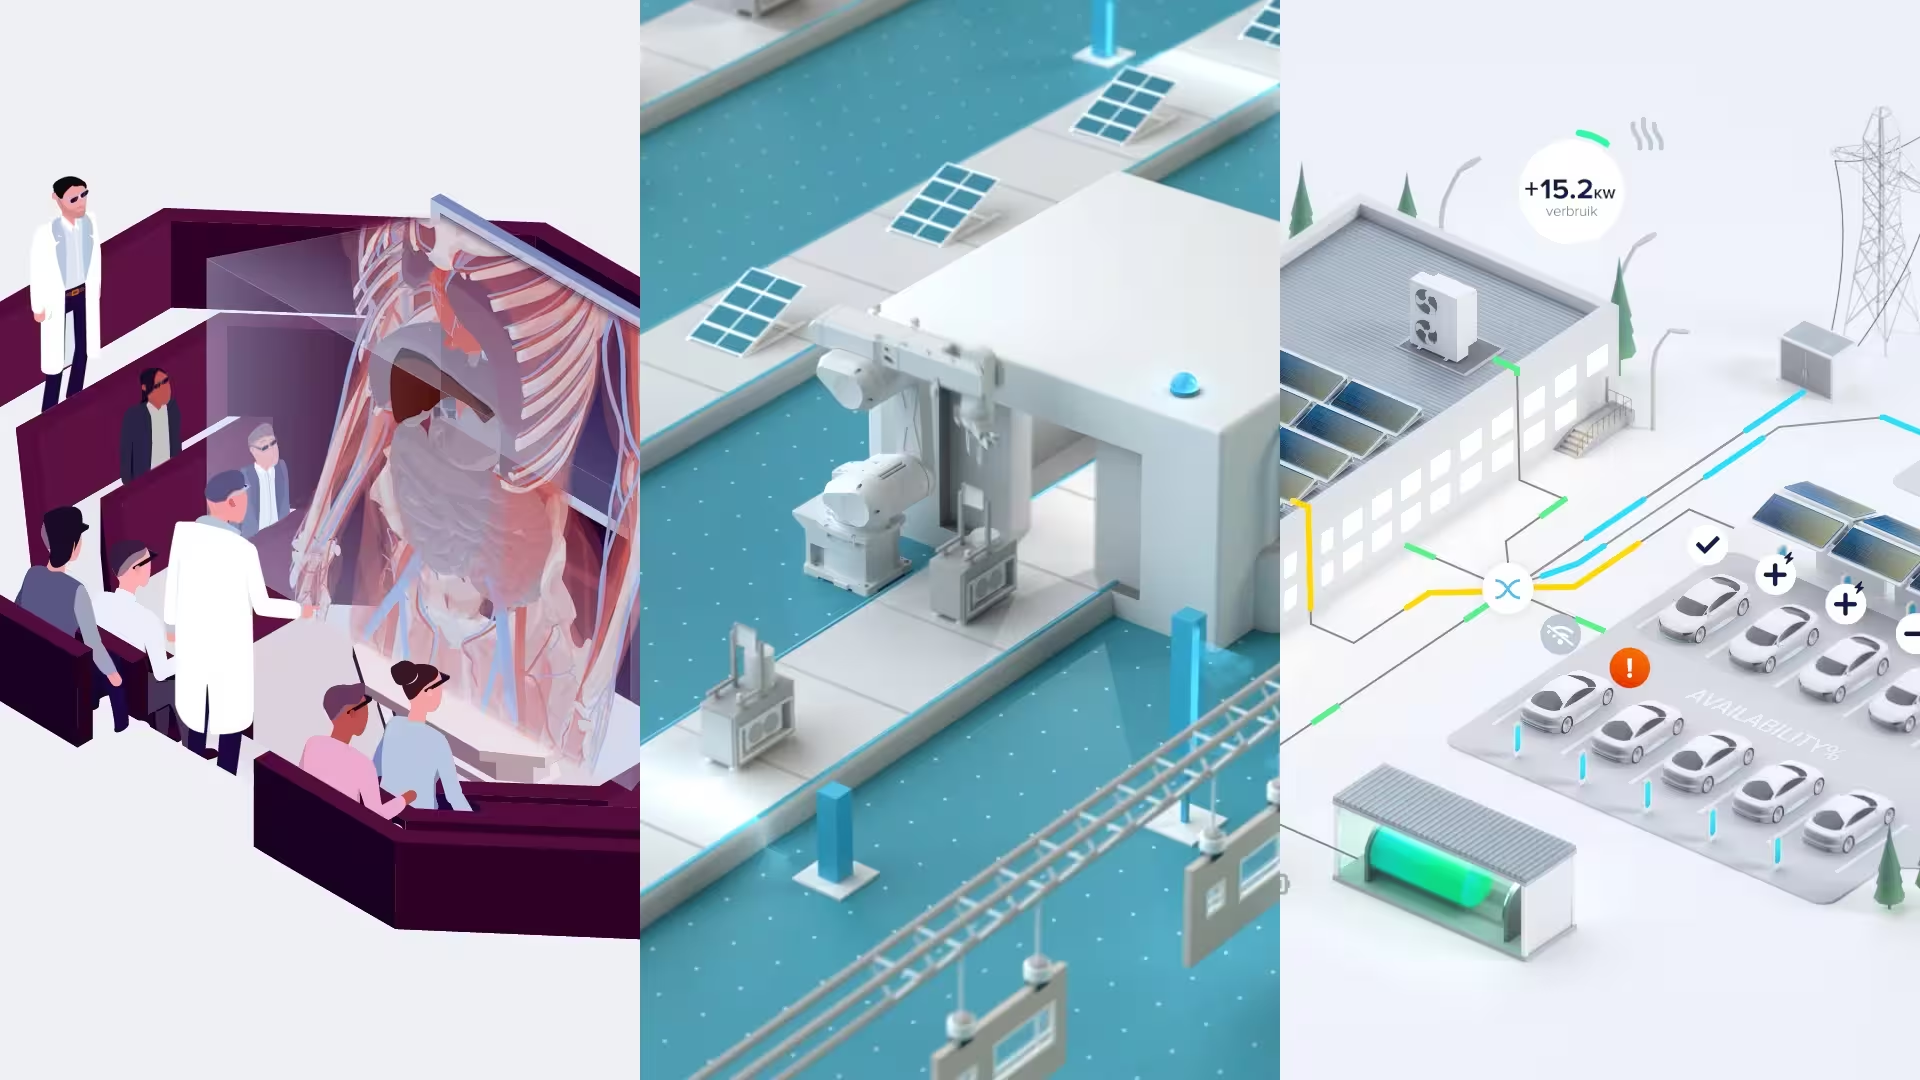
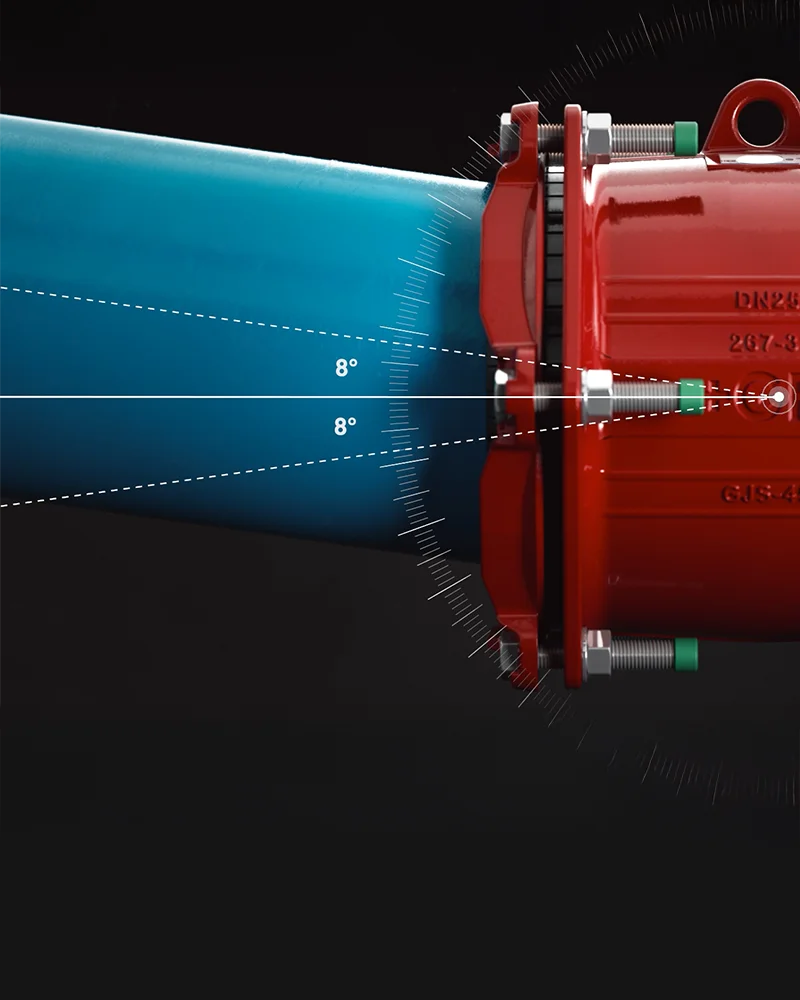
Drie illustraties: links artsen en publiek kijken naar een 3D-skeletprojectie; midden geautomatiseerde fabriek met robotarmen; rechts slimme parkeerplaats met elektrische auto's en zonnepanelen.Rode brandkraan met blauwe straal water die in een hoek van 8 graden uitmondt, gemarkeerd met lijnen en graden.

An infographic animation is not a chart that moves

Movement only adds something at three moments: when something grows, when something shifts, or when one thing causes another. If a figure stands still, a static infographic is stronger. You read it at your own pace, you can look back at it and you can drop it straight into a report.

Even so, we are often asked to animate an existing infographic. Bars that grow upwards, numbers that count up, icons that fly in. It looks busy and tells you nothing extra. Worse still: the viewer has to wait for information they could have seen at a glance.

At Rijkswaterstaat you can see the difference. The brief was two static infographics on Verkeersbeeld op Zee, the maritime traffic picture. But the story was a chain: first the infrastructure on the North Sea, then the connections, then the sensors, and only then usable information. You only see that relationship when the parts appear in that order. So we made panels that build up to the rhythm of the speaker. What is already there stays still. Only the new step moves.

That is why we don't start with the question of how something should move, but with the question of what changes. Sometimes the answer is: nothing. Then we recommend a static infographic, and we make it just as carefully.

3D animation for MARIN's Zero Emission Lab with glowing green parts

The right figures first, then the visuals

Most infographics contain too many figures. Not because anyone wanted that, but because nobody dared to choose.

So we start in your source files: the report, the spreadsheet or the presentation that already exists. Then we brainstorm together until the figures that carry the story come to the surface. From those we make a selection. Only then do we decide per figure whether it becomes static, moving or both.

That sounds like a delay, but it works the other way round. An infographic that contains everything has to be explained. An infographic with the right three figures explains itself.

Illustration of a workspace with a desk, computer and red chairIllustration of a workspace with a desk, computer and red chair

Do you have the figures, but not yet the story?

Then we start at exactly the right moment. Send along what you have; a report or a spreadsheet is enough. You will hear from us within one working day.

What sets us apart in infographic animation

An infographic is as strong as the weakest figure in it. That is why most of the work isn't in the design, but in what comes before it.

Street with an office building in Rotterdam
Group photo of the Studio Analoog team

We check the figures ourselves

A wrong figure in a beautiful infographic is worse than a wrong figure in a table, because everyone remembers it. We recalculate, compare with the source and ask questions if something doesn't add up. Only when the figure is right do the visuals go on.

One message per figure

Every figure on screen says one thing. If the viewer has to compare three things at once, we split it up or leave one out. What remains, sticks.

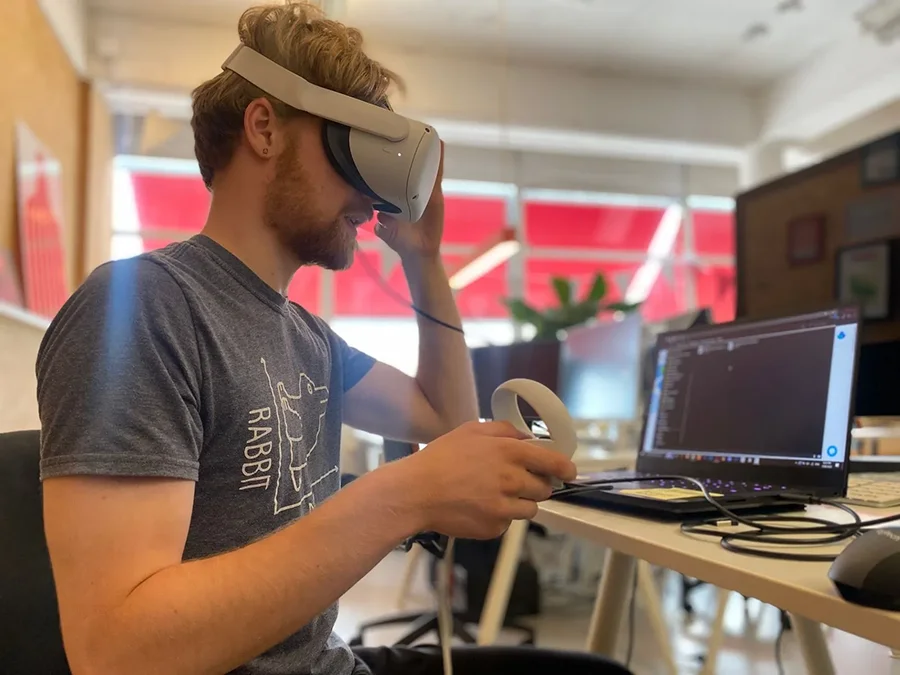
Alex from Studio Analoog testing a VR experience at his desk

From your source files

We build from the original data, not from a screenshot of a chart. That way the proportions are exactly right, and an update with new figures later is little work.

why us?

transit arrow white

Four projects where the
data carried the story

What clients say about
working with us and the results

"Your fantastic artwork helped make our vision understandable! This was extremely valuable in our development process and greatly contributed to securing multiple investment rounds."

Jan Willem Heinen
Co-founder & CEO - Maeve Aerospace
maeve aviation

“We always enjoy working with you! From start to finish, there's excellent communication, clear agreements, and high-quality production. You're constantly contributing ideas to achieve the best possible result, both creatively and technically."

Dave Valk
Designer & Owner - PlusDrie
plusdrie

“By combining your animation skills with our audiovisual expertise, we'll elevate the creative concept to the next level. You'll also deliver the right assets and files on time, and we'll work together to meet the deadline!"

Wouter Kooken
Owner & Creative Director - Blickfänger
blickfanger

"Working with Studio Analoog was impressive! They are true experts in their field. The final product made a huge impact, which we were able to showcase to state officials and important customers."

Jelle Wigboldus
Global Marketeer - Westfalia Fruit
Westfalia Fruit logo
logo client
logo client
logo client
logo client
logo client
logo client
logo client
logo client

One set, static and moving

Because we work from the source files, one production gives you both moving and static versions. Choosing up front is more cost-effective, because we then set up the production for it from the start. In concrete terms:

Presentation. Panels that build up along with the speaker, as for Rijkswaterstaat.

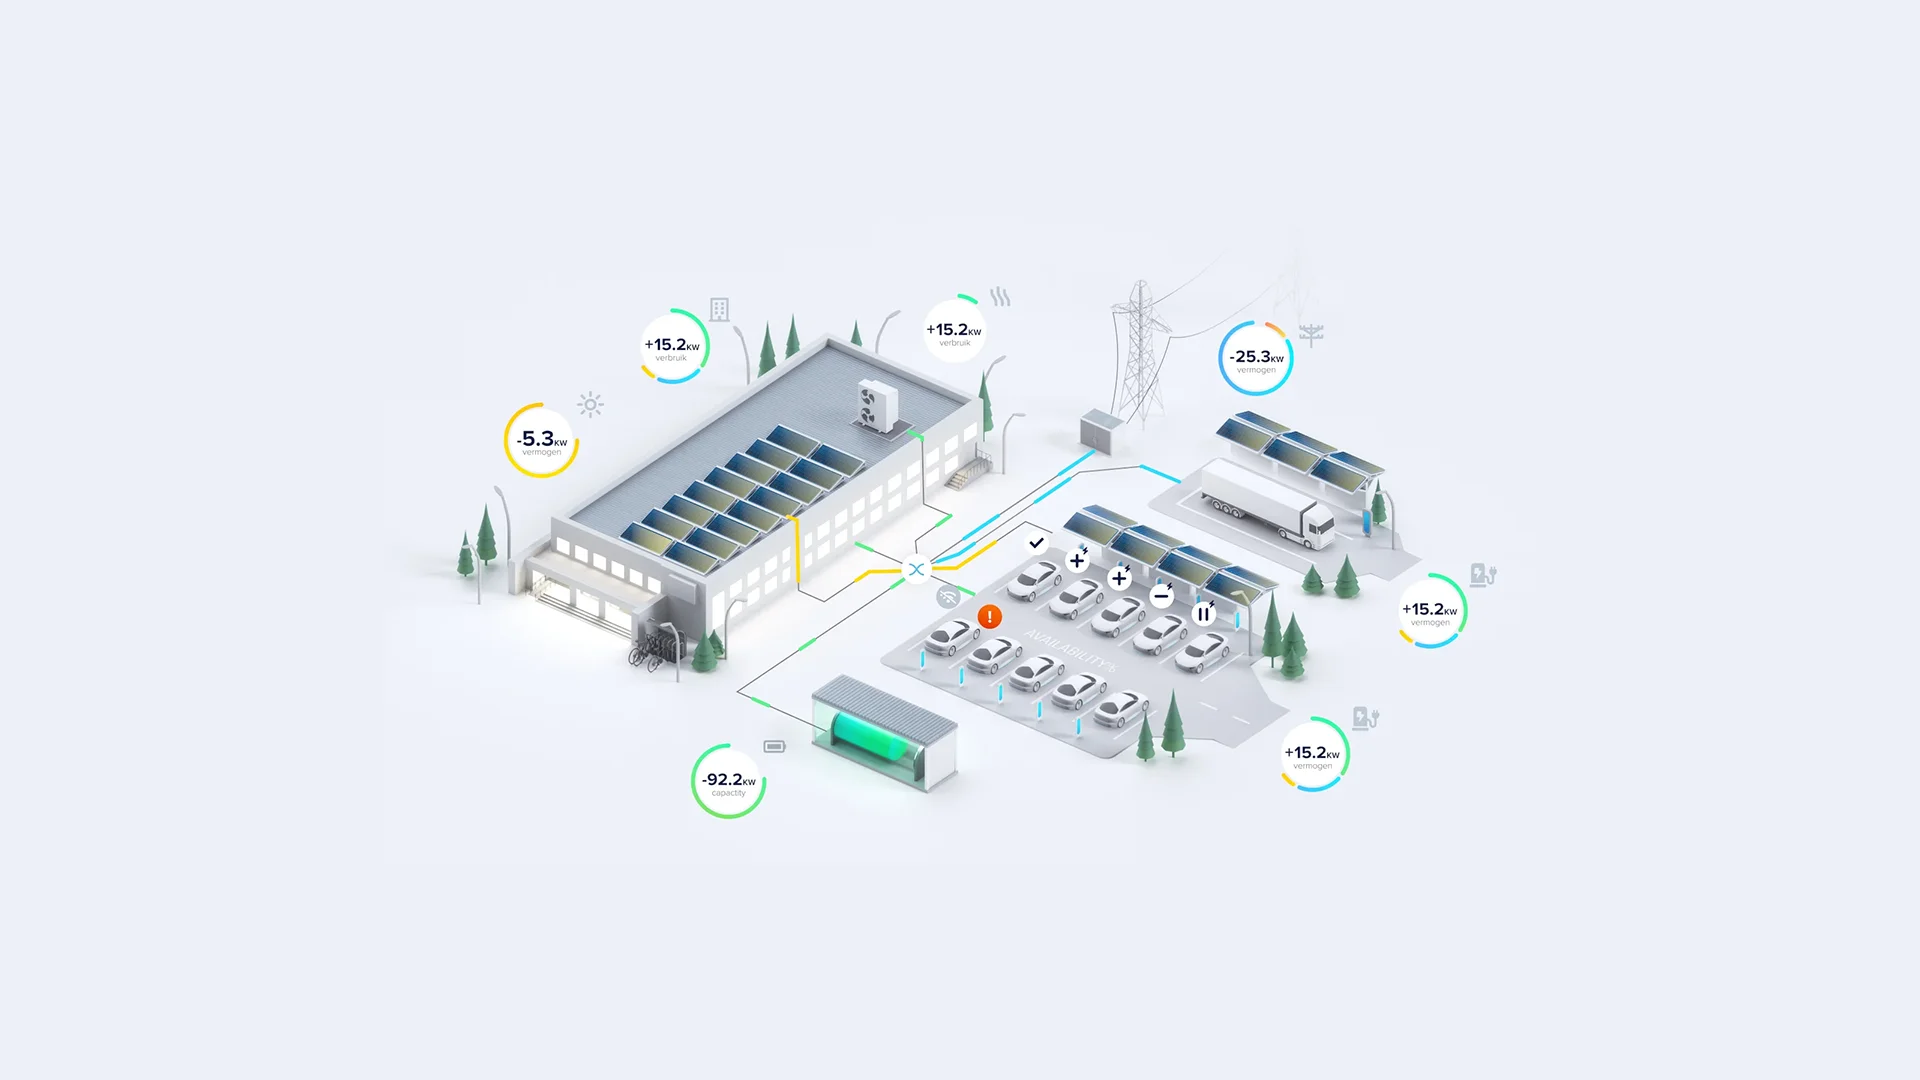
Dashboard or app. Animated components that show what is happening now, as for Maxem.

Website. A short animation that lands one figure, with a static version for those who want to read it again.

Report and annual report. Static infographics in the same visual language, for print and PDF.

Social media. Individual figures as a short animation or as an image, each with one message.

Trade show and event. A loop without sound that can also be read from a distance.

Illustration of a living room with people on the sofa

What an infographic animation costs

With us, an infographic animation starts from €10,000 excluding VAT. What mainly determines the price is how much data we need to get to grips with and how many versions you need.

Infographic animation: from €10,000, 4 to 6 weeks

Set, moving and static: €11,500 to €15,000, 6 to 8 weeks

All prices exclude VAT. The data research, the selection and the scenario are always included, because that is where most of the work lies.

Want to see the prices of all types of animation side by side? Take a look at animation production.

How an enquiry works with us

You will hear from us within one working day. Usually with a few questions, because a budget that makes sense doesn't come from a single email.

After that there are two routes. If you need a number now, we give a rough estimate based on what you have sent us. If you have half an hour, we discuss the project and you then receive a well-founded scope with a matching budget. The second route gives a better answer, and often a different project than you had in mind.

In a hurry? Feel free to call. We do the same the other way round.

How an infographic animation
comes together at our studio

Briefing

After your enquiry you will hear from us within one working day, usually with a few questions. Then we schedule an introduction. We focus straight away on the content and the context: what needs explaining, to whom, and where will the animation be used? Together we map out where the communication friction lies and which decision you want to speed up, whether that is sales, an investor presentation, onboarding or stakeholder communication. Based on that we make a proposal with a clear scope, timeline and budget, including options for reuse. Once approved, we get started.

Concept & storytelling

We translate the substance into a narrative: what does the viewer need to understand first, what comes next, and how do we build towards the core? This is the phase in which we do the most substantive sparring and lay the foundation for an animation that is logically structured. You receive a fully developed concept with core message, structure and tone of voice.

Kick-off

At the kick-off everyone involved sits at the table. We define the storyline, discuss the inspiration and ask each other questions: we about the content, you about the process. We agree the timeline, fix the feedback moments and agree who has a say and who bundles the feedback. That last agreement is the most important one of the whole project.

Storyboarding

The narrative is worked out visually in a storyboard. You see per scene what will appear on screen, how the structure flows and where the accents lie. This is the key moment to steer: changes here are fast and save costs further down the production.

Concept design

We develop the visual style: colour palette, atmosphere, level of detail and what the 3D models look like. This can range from hyper-realistic to abstract, depending on what suits the story and the brand. You receive style frames so you can see exactly which direction we are taking.

Production

The 3D scenes are built, animated and rendered. Because the substantive choices have already been made, this phase remains manageable and predictable. You receive interim previews, so we can adjust together if needed.

Sound

Music, sound effects and any voice-over are added. This largely determines the sense of professionalism and pacing. Good sound makes a significant difference in how an animation comes across and holds attention.

Release

The animation is delivered in the agreed formats and resolutions, ready for deployment. If agreed, we also deliver variants (stills, cutdowns, platform formats) and advise on the best deployment per channel.

Infographic, explainer animation or 2D?

Infographic animation. The figures are the story. It is about growth, shifts or cause and effect, and the proportions between them.

Explainer animation. A process or idea is central, figures at most play a supporting role. Then take a look at explainer animation production.

2D animation. That is a style, not a subject. Most infographic animations are 2D, but an explainer animation can also be 2D. You can read more about that choice at 2D animation production.

Often there is something of all three. In the first conversation we decide together where the emphasis lies.

Frequently asked questions about infographic animation

expand black

What does an infographic animation cost?

expand black

How long does it take?

expand black

Do we need to have the story already?

expand black

Can we update the figures later?

expand black

Why not just make an infographic with AI?

expand black

Do you also work for agencies?